Structural information color scheme:
In version 1.2, the pixel plot consisted of a black pixel for each residue and a white pixel
for each gap as shown in Figure 1.A. In SuiteMSA version 1.3, the residue pixels can be
color-coded as shown in Figure 1.B. The four possible structure-data based color-schemes are as follows:
- Transmembrane structure
- Secondary structure
- Rank data (red/yellow)
- Ranked data (blue/green)
Figure 1: Structural information display from MSA Viewer.
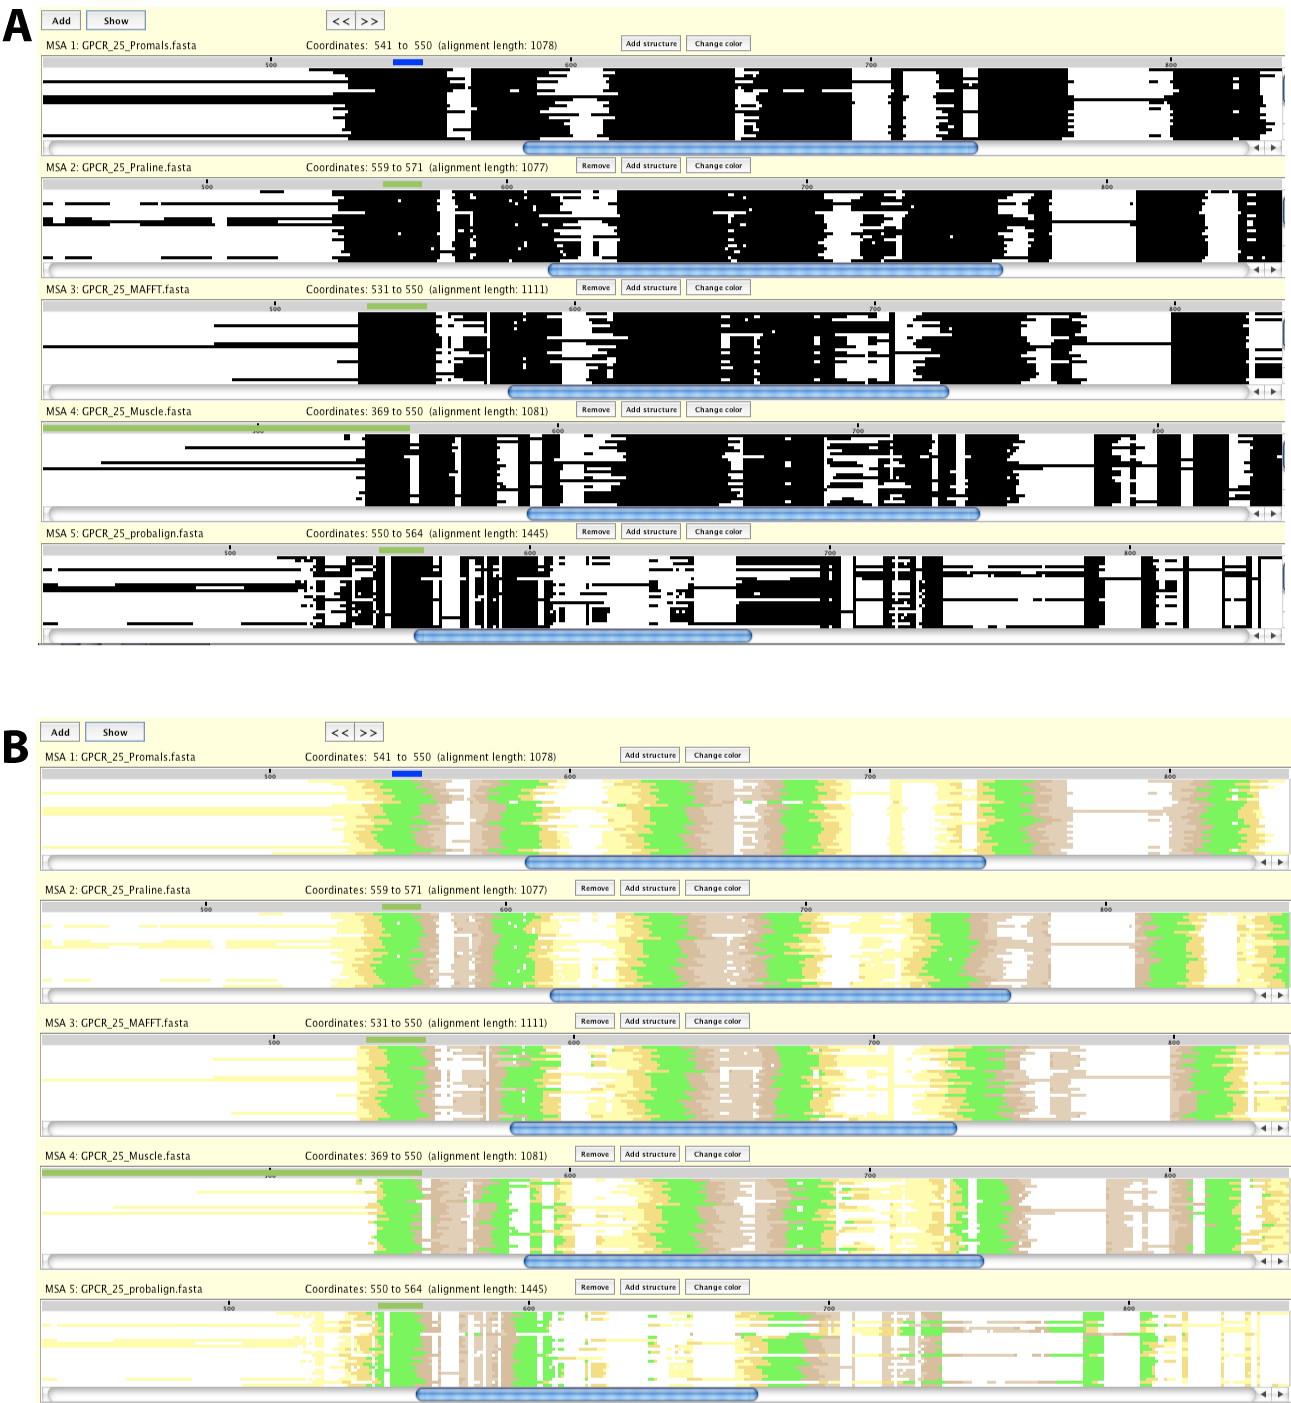
Two options for Pixel Plot with structure color scheme. :
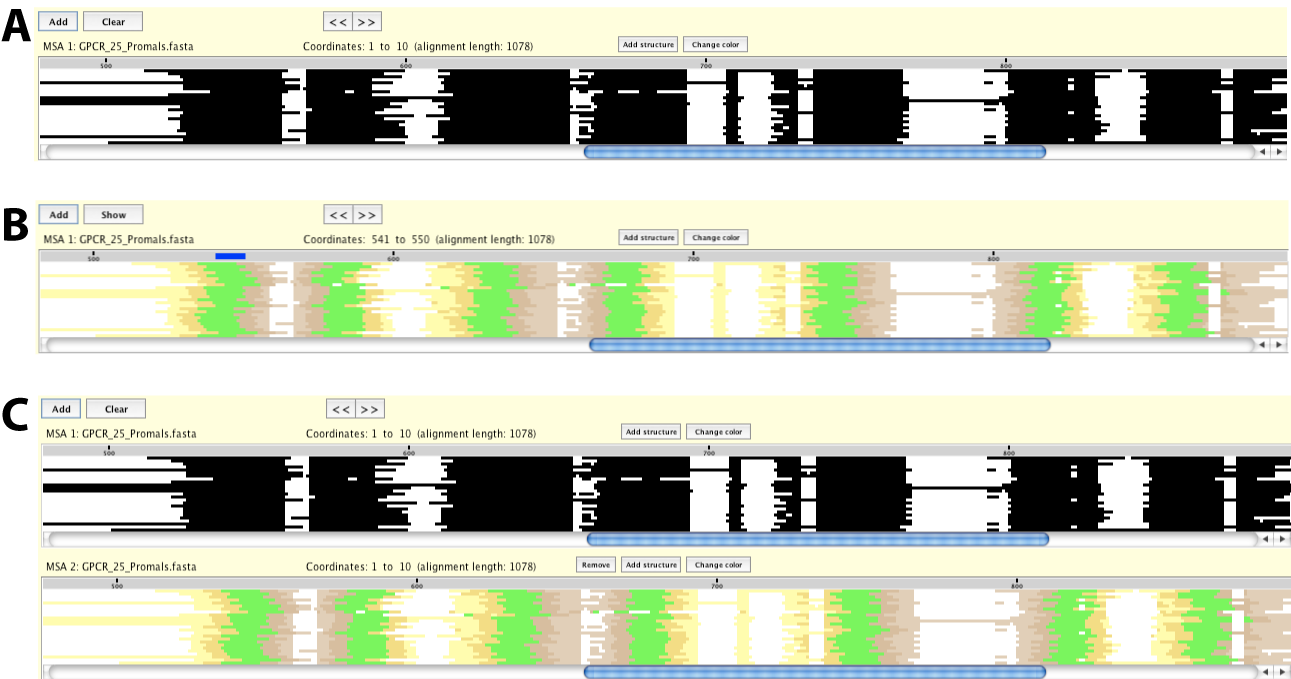
After the first pixel plot has been opened (Figure 2.A), there are two ways to access these color schemes.
To change the color scheme of the existing pixel plot, click on the Change color button immediately
above the pixel plot you want to change the color. This will bring up a pop-up window where you can
choose the type of structural data. After the structural data file is selected, the pixel plot will
be color-coded by the information provided (Figure 2.B).
To open an additional display of the same alignment with a different color scheme, click on the Add structure button. After selecting the type of structural data, a new pixel plot will be displayed color-coded by the information provided in the file (Figure 2.C).
To open an additional display of the same alignment with a different color scheme, click on the Add structure button. After selecting the type of structural data, a new pixel plot will be displayed color-coded by the information provided in the file (Figure 2.C).
Figure 2: Two options for Pixel Plot with structure color scheme. .